A water footprint shows the extent of water use in relation to consumption by people. The water footprint of an individual, community or business is defined as the total volume of fresh water used to produce the goods and services consumed by the individual or community or produced by the business.
Water use is measured in water volume consumed (evaporated) and/or polluted per unit of time. A water footprint can be calculated for any well-defined group of consumers (e.g., an individual, family, village, city, province, state or nation) or producers (e.g., a public organization, private enterprise or economic sector), for a single process (such as growing rice) or for any product or service.

Traditionally, water use has been approached from the production side, by quantifying the following three columns of water use: water withdrawals in the agricultural, industrial, and domestic sector. While this does provide valuable data, it is a limited way of looking at water use in a globalised world, in which products are not always consumed in their country of origin. International trade of agricultural and industrial products in effect creates a global flow of virtual water, or embodied water (akin to the concept of embodied energy).
In 2002, the water footprint concept was introduced in order to have a consumption-based indicator of water use, that could provide useful information in addition to the traditional production-sector-based indicators of water use. It is analogous to the ecological footprint concept introduced in the 1990s. The water footprint is a geographically explicit indicator, not only showing volumes of water use and pollution, but also the locations. Thus, it gives a grasp on how economic choices and processes influence the availability of adequate water resources and other ecological realities across the globe (and vice versa)
What is a water footprint?
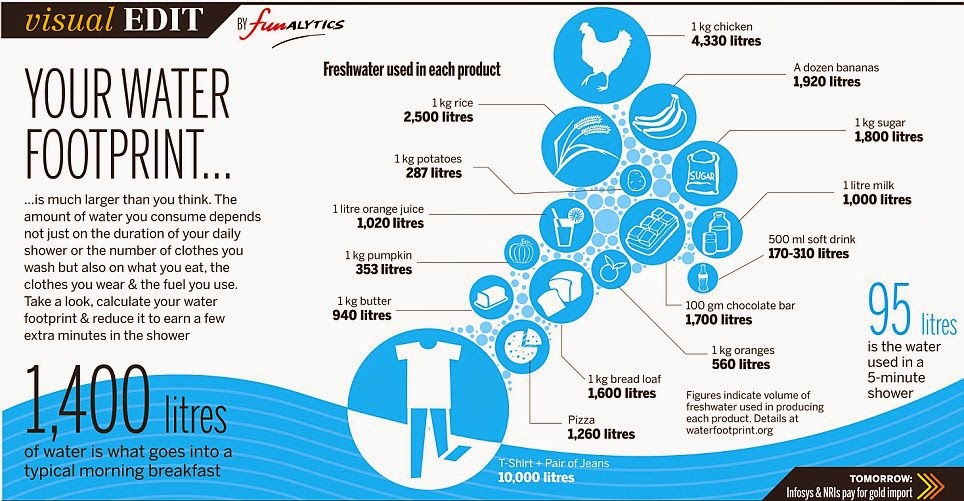
Everything we use, wear, buy, sell and eat takes water to make.
The water footprint measures the amount of water used to produce each of the goods and services we use. It can be measured for a single process, such as growing rice, for a product, such as a pair of jeans, for the fuel we put in our car, or for an entire multi-national company. The water footprint can also tell us how much water is being consumed by a particular country – or globally – in a specific river basin or from an aquifer.
“The water footprint is a measure of humanity’s appropriation of fresh water in volumes of water consumed and/or polluted.”
The water footprint allows us to answer a broad range of questions for companies, governments and individuals. For example:
- Where is the water dependence in my company’s operations or supply chain?
- How well are regulations protecting our water resources?
- How secure are our food or energy supplies?
- Can I do something to reduce my own water footprint and help us manage water for both people and nature?
Depending on the question you are asking, the water footprint can be measured in cubic metres per tonne of production, per hectare of cropland, per unit of currency and in other functional units. The water footprint helps us understand for what purposes our limited freshwater resources are being consumed and polluted. The impact it has depends on where the water is taken from and when. If it comes from a place where water is already scarce, the consequences can be significant and require action.
The water footprint has three components: green, blue and grey. Together, these components provide a comprehensive picture of water use by delineating the source of water consumed, either as rainfall/soil moisture or surface/groundwater, and the volume of fresh water required for assimilation of pollutants.
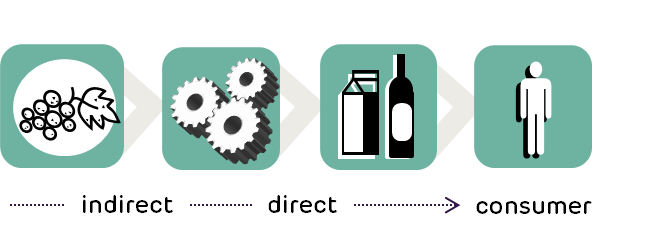
Direct and indirect water use
The water footprint looks at both direct and indirect water use of a process, product, company or sector and includes water consumption and pollution throughout the full production cycle from the supply chain to the end-user.

It is also possible to use the water footprint to measure the amount of water required to produce all the goods and services consumed by the individual or community, a nation or all of humanity. This also includes the direct water footprint, which is the water used directly by the individual(s) and the indirect water footprint – the summation of the water footprints of all the products consumed.
The three water footprints:

Green water footprint
Green water footprint is water from precipitation that is stored in the root zone of the soil and evaporated, transpired or incorporated by plants. It is particularly relevant for agricultural, horticultural and forestry products.

Blue water footprint
Blue water footprint is water that has been sourced from surface or groundwater resources and is either evaporated, incorporated into a product or taken from one body of water and returned to another, or returned at a different time. Irrigated agriculture, industry and domestic water use can each have a blue water footprint.

Grey water footprint
Grey water footprint is the amount of fresh water required to assimilate pollutants to meet specific water quality standards. The grey water footprint considers point-source pollution discharged to a freshwater resource directly through a pipe or indirectly through runoff or leaching from the soil, impervious surfaces, or other diffuse sources.

The relation between consumption and water use
“The interest in the water footprint is rooted in the recognition that human impacts on freshwater systems can ultimately be linked to human consumption, and that issues like water shortages and pollution can be better understood and addressed by considering production and supply chains as a whole,” says Professor Arjen Y. Hoekstra, creator of the water footprint concept.
“Water problems are often closely tied to the structure of the global economy. Many countries have significantly externalised their water footprint, importing water-intensive goods from elsewhere. This puts pressure on the water resources in the exporting regions, where too often mechanisms for wise water governance and conservation are lacking. Not only governments, but also consumers, businesses and civil society communities can play a role in achieving a better management of water resources.”

Some facts and figures
- The production of one kilogramme of beef requires approximately 15 thousand litres of water (93% green, 4% blue, 3% grey water footprint). There is a huge variation around this global average. The precise footprint of a piece of beef depends on factors such as the type of production system and the composition and origin of the feed of the cow.
- The water footprint of a 150-gramme soy burger produced in the Netherlands is about 160 litres. A beef burger from the same country costs on average about 1000 litres
- The water footprint of Chinese consumption is about 1070 cubic metres per year per capita. About 10% of the Chinese water footprint falls outside China.
- Japan with a footprint of 1380 cubic metres per year per capita, has about 77% of its total water footprint outside the borders of the country.
- The water footprint of US citizens is 2840 cubic meter per year per capita. About 20% of this water footprint is external. The largest external water footprint of US consumption lies in the Yangtze River Basin, China.
- The global water footprint of humanity in the period 1996-2005 was 9087 billions of cubic meters per year (74% green, 11% blue, 15% grey). Agricultural production contributes 92% to this total footprint.
- Water scarcity affects over 2.7 billion people for at least one month each year.
- Rain is the original water made in the Sky for our survival.
Water is life,
Save it right ….!!
Vardhman Envirotech,
India’s Passionate Rainwater Company
